Part I: Understanding the RF Spectrum Measurements
The Spectrum Analyzer has a bandpass filter (IF filter) which is used as the “window” for detecting signals. The bandpass filter’s bandwidth is also called the resolution bandwidth(RBW) of the analyzer and can be changed by the user [2]. For example, the Figure 1 shows the Spectrum of WIFI Channel 9 which has the 2452Mhz center frequency and the 20Mhz Channel Width. Green vertical bar indicates the power measurement in the corresponding “window” (10KHz).
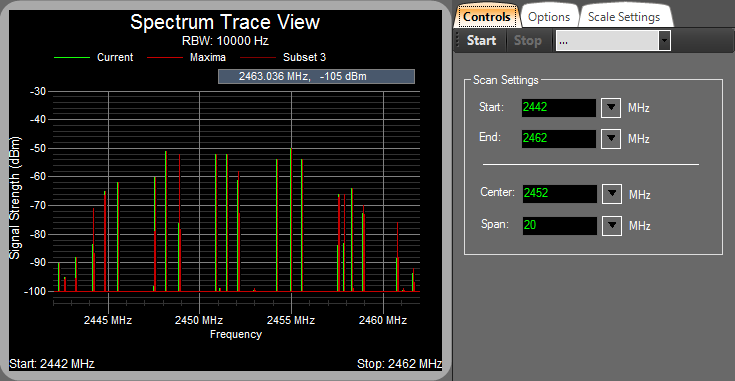
Figure 1: Spectrum of the WIFI router Channel 9, measured from distance of 1 meter
Sometimes, we may want to know what is the power within a frequency range, called the channel bandwidth. E.g. We may want to measure the power within the channel bandwidth shown in the Figure 1. Actually, the power within a channel bandwidth could be calculated based on the Spectrum Measurements [1]. The result comes from the computation:
$latex {{P}_{ch}}=10{{\log }_{10}}((\frac{{{B}_{s}}}{RBW})(\frac{1}{N})\sum\limits_{i=1}^{N}{{{10}^{(\frac{{{P}_{i}}}{10})}}})$
$latex P_{ch}$ is the power in the channel (dBm)
$latex B_{s}$ is the specified bandwidth, also known as the channel bandwidth (Hz)
RBW is the resolution bandwidth (Hz)
N is the number of data points in the summation
$latex P_{i}$ is the sample of the power in measurement cell i in dBm units.
If we need the $latex P_{ch}$ in milliwatts, then the formula will be:
$latex {{P}_{ch}}=(\frac{{{B}_{s}}}{RBW})(\frac{1}{N})\sum\limits_{i=1}^{N}{{{10}^{(\frac{{{P}_{i}}}{10})}}}$
Part II: Channel Power Calculation using Matlab
We already got the method which can calculate the Channel Power based on the Spectrum Measurements in the Part I, but the practical problem is that we may have a great number of data points in the summation which causes the hand calculation to be meaningless. Therefore, I wrote a Matlab function to do the calculation for us.
function [ power ] = RFpower( BS,RBW,P )
%   Author: Neil (Bing) Hao
% HomePage: https://www.uniteng.com
% BS is the specified bandwidth (Hz)
% RBW (Hz)
% P is the sample of the power in measurement cell i in dBm units
% power is the Channel power (dBm)

%print out BS and RBW
fprintf( 'BS is %d \n', BS );
fprintf( 'RBW is %d \n', RBW );

%Get size of P, P is expected to be a 1*n or n*1 matrix
n = max(size(P));
%print out n
fprintf( 'n is %d \n', n);

% Summation
sum =0;
for i=1:n
    sum = sum+10^(P(i)/10);
end

% Calculate power in dBm
power = 10*log10((BS/RBW)*(1/n)*sum);

end
Note: Modify the line 25 to be power = (BS/RBW)*(1/n)*sum;, the power will be in milliwatts.
To use this function, we need to export the Spectrum Measurements form the Spectrum Analyzer, and then import the data into a 1*n or n*1 matrix in the Matlab. E.g. I imported the data shown in the Figure 1 into the matrix P in Matlab. The calculation result is shown in the following segment:
>> RFpower(20000000,10000,P)
BS is 20000000
RBW is 10000
n is 2034

ans =

  -41.1004
The channel bandwidth is 20Mhz, the RBW is 10KHz and the P contains 2034 data points. Finally, the channel power is -41.1004 dBm.
Part III: References
[1] Agilent Spectrum and Signal Analyzer Measurements and Noise. Retrieved July 25, 2013, from http://literature.agilent.com/litweb/pdf/5966-4008E.pdf (Local Mirror)
[2] Spectrum Analyzer Basics. Retrieved July 25, 2013, from http://literature.agilent.com/litweb/pdf/5965-7920E.pdf